
How the Pandemic Has Affected Bike Share Toronto Ridership
An analysis of Bike Share Toronto 2019 and 2020 ridership data
Bike Share Toronto (BikeShareTO) is Toronto’s bicycle-sharing system and they recently shared their ridership data for the years 2019 and 2020. As an avid BikeShareTO user, I was curious to see how the pandemic has affected the bike-sharing system’s patterns of ridership.
For those unfamiliar with how BikeShareTO works, the bicycle-sharing system consists of 6850 bicylces and 650 stations across the city. Users can borrow a bike from any station and return it to any station as long as the bike trip is less than 30 minutes. (Trips longer than 30 minutes incur a fine.) Users can purchase an Annual Membership that allows them unlimited 30-minute bike trips for a year, or they can purchase short-term passes varying from 30 minutes to 3 weeks as a Casual Member.
Here are my three main findings along with accompanying data visualizations.
First, there were half a million more bike-share trips in 2020 compared to 2019, which is a 10 percent increase. Nearly all of the increase in bike-share trips came from Casual Members who are short-term, recreational users of the service.
While the number of bike-share trips for Annual Members remained unchanged, the number of trips by short-term users almost doubled from 580K in 2019 to 1 million in 2020. This increase in demand for short-term, recreational use of BikeShareTO was probably driven by people using cycling to exercise and get some fresh air during the lockdown, and helped by Toronto’s ActiveTO initiative.
Second, the number of people using BikeshareTO for commuting to work dropped significantly in 2020.
This finding is not surprising given that many businesses were closed due to the shutdown and stay-at-home orders resulting from the pandemic.
We can infer this from two data points: One, there is a drastic fall in bike-share trips during the 8 AM morning rush hour among Annual Members as well as a smaller fall in the number of trips during the evening 5 PM rush hour. (The fall of ridership during the evening rush hour is less pronounced because, as the graphs below show, both Annual Members and Casual Members increased their use of BikeShareTO for recreational purposes.)
Two, for Annual Members, there is a large decrease in the number of “popular” stations - that is, bikeshare stations that served as starting points for more than 10,000 trips. Since people who use bike-share for commuting have Annual Memberships, this suggests that the number of bike trips made for commuting decreased significantly. On the other hand, the number of popular stations increased for Casual Members along the Martin Goodman trail on Toronto’s scenic lakefront reflecting the surge in demand for recreational use.
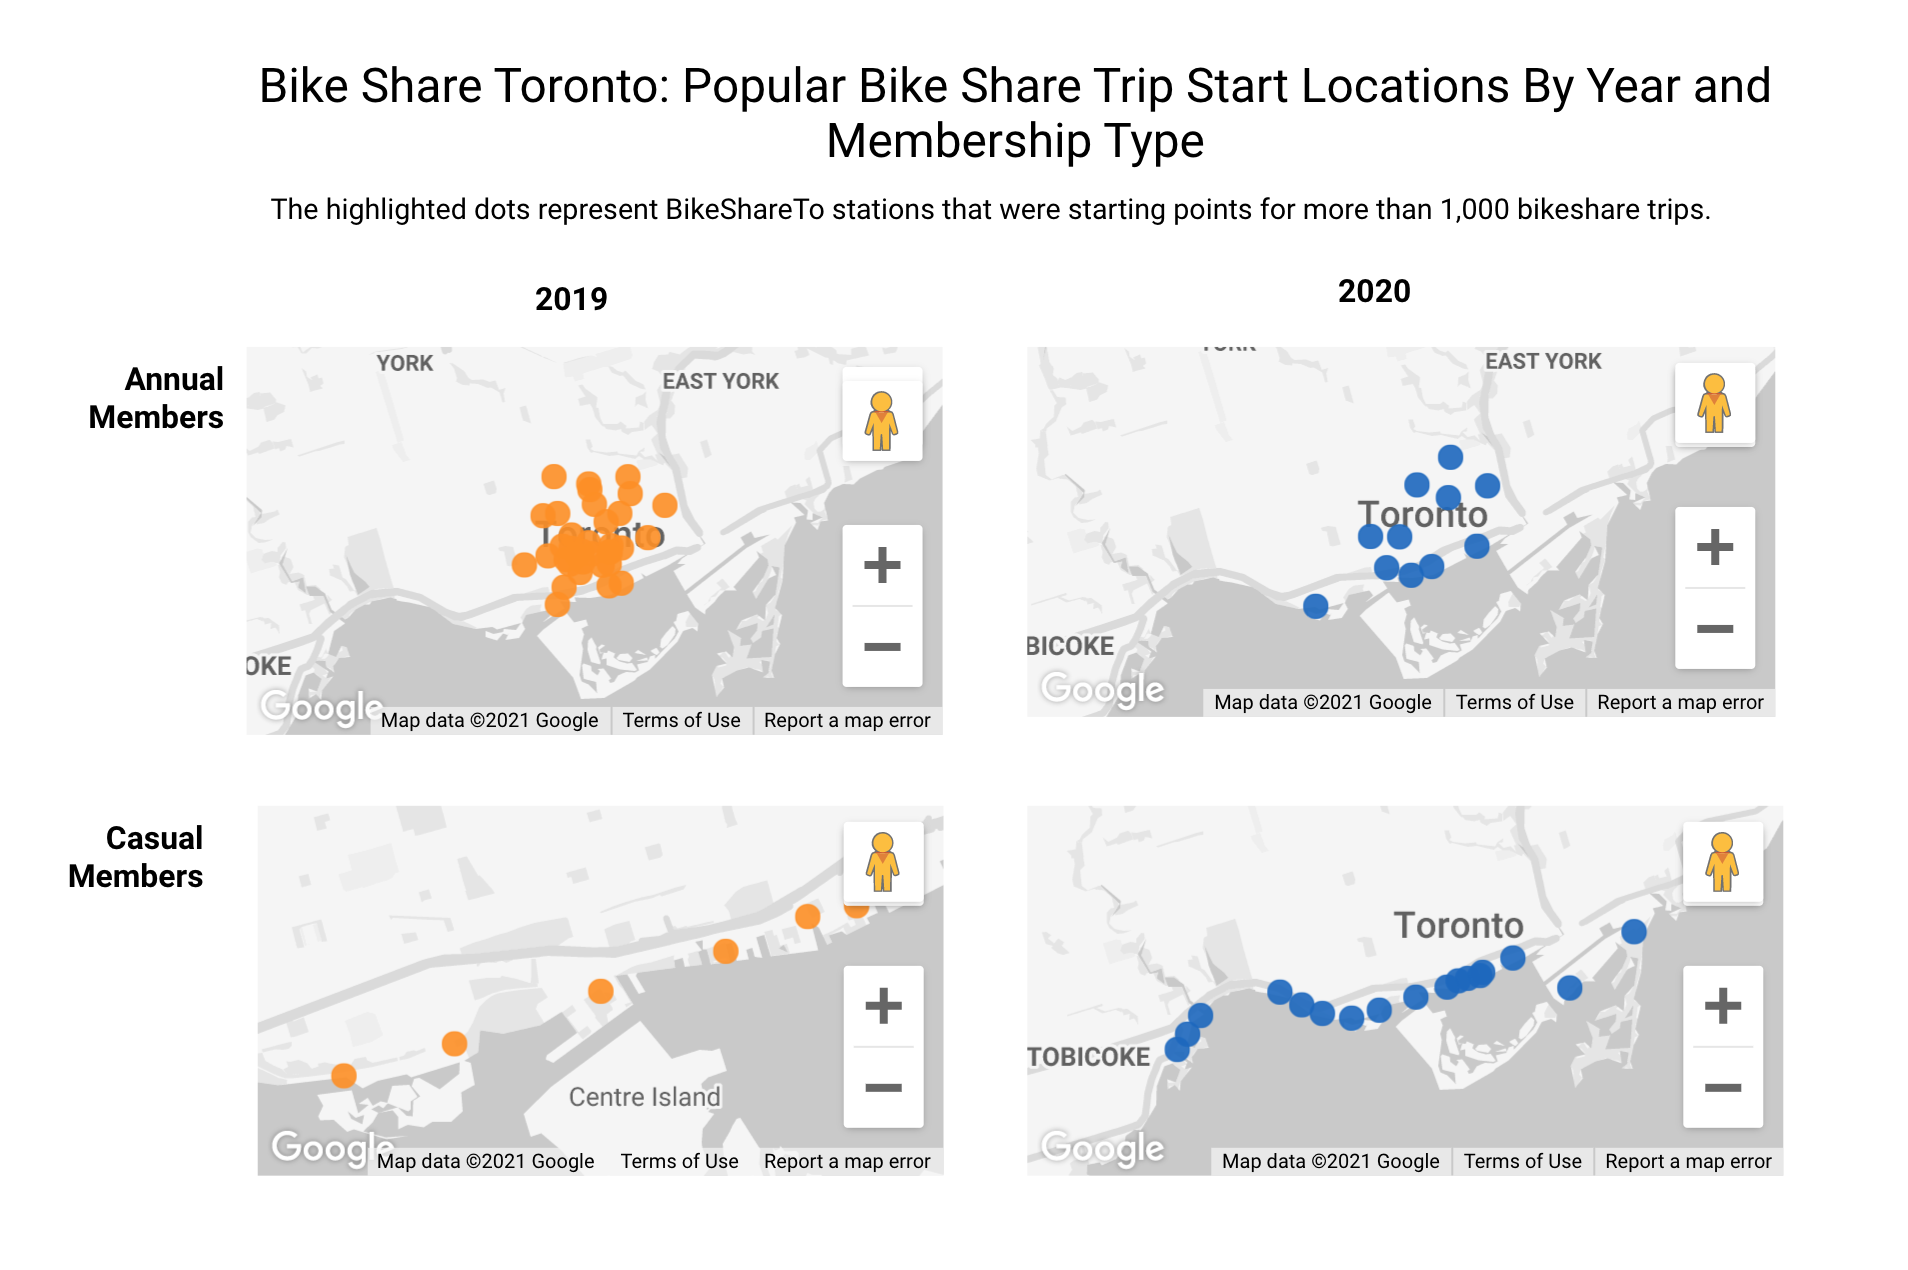
(Please click here for an interactive map since Data Studio currently does not currently enable embedding map visualizations in blog posts.)
Third, significantly more Annual Members used BikeShare for short-term, recreational purposes in 2020 compared to 2019.
From the chart below, we see that the number of bike trips by Annual Members on weekends increased significantly even though it fell for all weekdays showing increased demand for short-term, recreational use of the service. On the other hand, ridership by Casual Members for recreational purposes nearly doubled for every day of the week.
Even though these findings are not very surprising, it is interesting to see them revealed in data.
Data
Bike Share Toronto ridership data is made available by the City of Toronto through it’s Open Data initiative. The data for 2019 is divided quarterly into four CSV files whereas the 2020 data is divided monthly in twelve CSV files. In addition, the data for bike stations’ location is available in JSON format. For data visualizations, I used Google Data Studio with BigQuery as the data source. To read more about the extract, transform, and load process of the data into BigQuery using Cloud Dataflow, please read my next blogpost.